Zero-Downtime Blue/Green Deployments with Kubernetes Ingress & Flagger
Eliminate 502 gateway drops and silent state desynchronization: Progressive canary routing, Prometheus P99 latency gates, NGINX Ingress annotations, and automated rollbacks with Flagger.
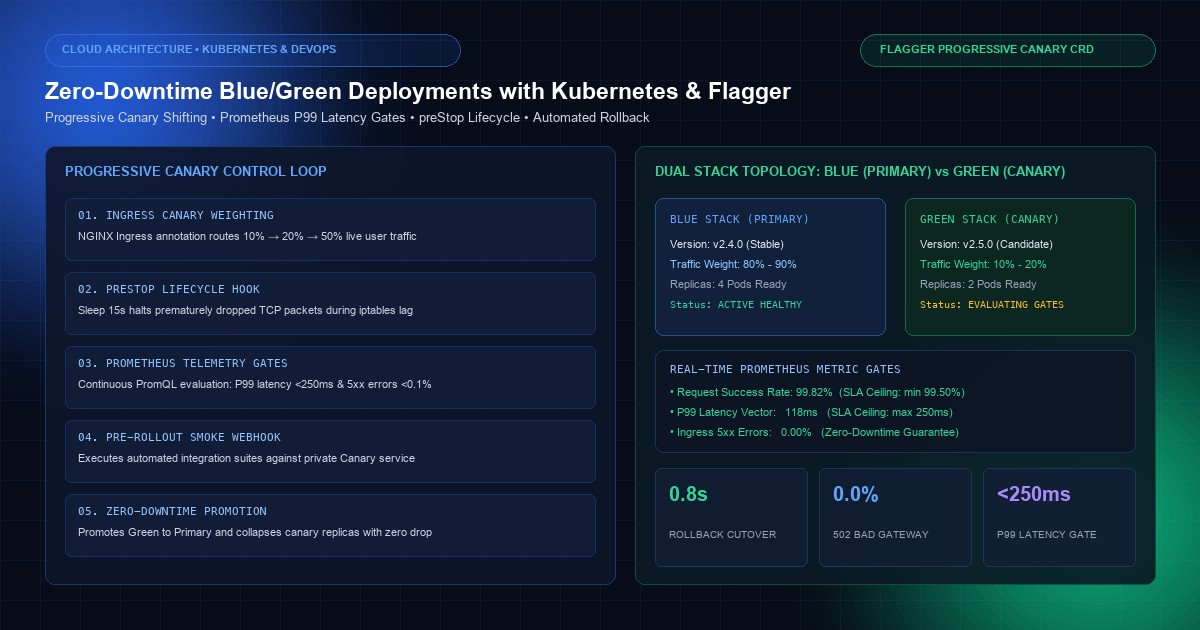
In mission-critical cloud engineering, zero-downtime deployments are often treated as a solved problem. Engineering teams configure a standard Kubernetes Deployment object with strategy: type: RollingUpdate, set maxSurge: 25% and maxUnavailable: 0, and assume their production traffic is completely insulated from connection dropped errors.
Yet under peak production concurrency, this naive assumption shatters.
During standard rolling deployments, distributed microservices routinely suffer from transient 502 Bad Gateway spikes, dropped in-flight TCP streams, database connection pool exhaustion, and catastrophic state desynchronization when frontend clients communicate simultaneously with two mutually incompatible API schemas. When an untested regression slips through CI/CD pipelines, Kubernetes dutifully rolls out the broken container image across 100% of the replica set before humans can react.
True zero-downtime enterprise delivery requires a Progressive Delivery & Blue/Green Architecture. By decoupling deployment from release—using declarative Canary and Blue/Green operators like Flagger, continuous Prometheus statistical telemetry, and intelligent Ingress routing—teams can validate new container versions against live production traffic, verify latency thresholds, and trigger automated sub-second rollbacks without dropping a single customer request.
At KNetwork's Cloud Migration & DevOps practice, we architect bulletproof progressive deployment topologies for high-concurrency fintech platforms, real-time telemetry brokers, and distributed SaaS engines. In this deep-dive architectural playbook, we unpack the hidden failure modes of Kubernetes rolling updates, model progressive traffic routing, implement a production Flagger CRD with NGINX Ingress, configure P99 latency gates, and execute an automated failure simulation with instant rollback.
1. The Silent 502 Tax: Why Standard Rolling Updates Fail Enterprise SLAs#
To understand why traditional Kubernetes deployments fail under load, we must trace what occurs across the Linux networking stack when a Pod is terminated and replaced:
┌────────────────────────────────────────────────────────────────────────┐
│ NAIVE ROLLING 400 font-semibold">UPDATE RACE CONDITION                                    │
└────────────────────────────────────────────────────────────────────────┘

 [API Server] ──── (1) Delete Pod Event ────► [kube-proxy / CNI Plugin]
      │                                                │
      │                                                ▼ (Asynchronous Delay: 1.5s - 4.0s)
      │                                       iptables / IPVS rule removal
      │                                                │
      ▼ (Simultaneous)                                 ▼
 [Kubelet on Node] ──► (2) Sends SIGTERM ──► [Container Application]
                                                       │
                                              Stops listening immediately
                                                       │
 [Ingress Controller] ─── (3) Routes 400 font-semibold">new TCP traffic ──┘
                                  │
                                  ▼
                     ❌ 502 Bad Gateway / Connection Refused
When kubectl apply triggers a revision update, two independent, asynchronous workflows run simultaneously:
1.1 The Endpoint De-registration Lag#
- The Kubernetes Control Plane updates the
Endpoints/EndpointSliceobject, marking the old Pod as terminating. - The Ingress Controller and
kube-proxywatch this event and begin recalculating routing tables (updatingiptableschains or IPVS virtual servers). - In production clusters with hundreds of nodes and dozens of namespaces, this iptables distribution takes between 1,500ms and 5,000ms to propagate across all worker nodes.
1.2 The Premature SIGTERM#
- Concurrently, the local
kubeletsends aSIGTERMsignal directly to the application container. - Most backend frameworks (Node.js, Python FastAPI, Go HTTP servers, JVM Spring Boot) catch
SIGTERMand immediately close the listening socket, refusing new incoming TCP SYN packets. - Because the Ingress controller’s routing table has not yet updated due to the de-registration lag, it continues dispatching new client requests to the terminating Pod.
- The Result: The client immediately receives a
502 Bad GatewayorECONNREFUSEDerror.
1.3 In-Flight Request Truncation#
If a backend service processes long-lived transactions—such as multi-second PDF generations, database batch insertions, or streaming WebSockets—a defaultterminationGracePeriodSeconds: 30 abruptly sends SIGKILL, severing active client streams midway through execution and leaving the database in an inconsistent state.2. Progressive Delivery Taxonomy: Rolling vs. Canary vs. Blue/Green#
To eliminate deployment risk, enterprise systems decouple software release from software deployment:
DEPLOYMENT STRATEGY COMPARISON:

┌─────────────────┬───────────────────┬──────────────────┬───────────────────┐
│ Metric / Vector │ Rolling Update    │ Blue/Green       │ Canary Delivery   │
├─────────────────┼───────────────────┼──────────────────┼───────────────────┤
│ Traffic Switch  │ Pod-by-Pod        │ Instant (0→100%) │ Incremental Steps │
│ Infrastructure  │ 100% + maxSurge   │ 200% (2x Stacks) │ 100% + Canary %   │
│ Blast Radius    │ High (All users)  │ Total 400 font-semibold">if broken  │ Minimal (1% - 10%)│
│ Metric Testing  │ Basic Liveness    │ Pre-cutover synthetic P99 Latency & Error│
│ Rollback Time   │ 2 - 5 Minutes     │ Sub-second       │ Sub-second        │
│ Schema Drift    │ Extreme risk      │ Managed via v2   │ Requires dual-read│
└─────────────────┴───────────────────┴──────────────────┴───────────────────┘
The Blue/Green Paradigm#
Blue/Green deployment provisions two identical environments:- Blue (Active): Currently handles 100% of live user traffic.
- Green (Idle/Staging): Runs the newly deployed container version.
Once Green passes automated integration suites, end-to-end smoke tests, and security scans, the ingress routing layer flips traffic from Blue to Green instantaneously. If anomalies appear, flipping the router back to Blue restores service in milliseconds.
The Canary Extension with Flagger#
While classic Blue/Green switches 100% of traffic in a single cutover, Canary Progressive Delivery shifts traffic incrementally:0% ➔ 5% ➔ 10% ➔ 25% ➔ 50% ➔ 100%. At each step, Flagger analyzes Prometheus metrics against real-time operational thresholds (e.g., HTTP 5xx error rate < 0.1%, P99 response time < 120ms). If any threshold is breached, the rollout aborts and rolls back to Blue automatically.3. The Flagger Architecture: Operators, CRDs, and Traffic Shifters#
Flagger is a Cloud Native Computing Foundation (CNCF) project designed to automate progressive delivery on Kubernetes. It operates as a Kubernetes controller that manages the release lifecycle using custom resources.
┌────────────────────────────────────────────────────────────────────────┐
│ FLAGGER PROGRESSIVE DELIVERY CONTROL LOOP                              │
└────────────────────────────────────────────────────────────────────────┘

  [Engineer / CI Pipeline] ──► Updates Target Deployment Image
            │
            ▼
  [Flagger Controller] ──────► Detects PodSpec Revision Change
            │
            ├─► Scales up Green Primary Stack
            ├─► Provisions Ingress Canary Annotations
            │
            ▼
  [Traffic Shifting Engine] ──► Routes 5% Live Traffic to Canary
            │
            ▼
  [Prometheus Metrics Loop] ──► Checks P99 Latency & Error Rate (Every 60s)
            │
      ┌─────┴─────────────────────────────────┐
      ▼ (Metrics Healthy)                     ▼ (Threshold Breached)
  Shift to 10% ➔ 20% ➔ 50% ➔ 100%        ABORT & ROLLBACK
  Promote Green to Primary               Traffic restored to 0% Canary
  Scale down old Blue Stack              Zero Downtime Alert Dispatched
Flagger integrates natively with:
- Service Meshes: Istio, Linkerd, AWS App Mesh.
- Ingress Controllers: NGINX Ingress, Traefik, Contour, Envoy Gateway, Gloo.
- Metric Providers: Prometheus, Datadog, CloudWatch, Dynatrace.
In this implementation, we utilize NGINX Ingress Controller, which shifts traffic using standard ingress canary annotations without the architectural overhead of an entire service mesh.
4. Pod Lifecycle Hardening: Eliminating Dropped Connections#
Before Flagger can manage traffic, the underlying application Pod must be hardened against lifecycle race conditions. We implement two critical primitives: preStop sleep hooks and readiness probe stabilization.
4.1 Production Kubernetes Deployment Manifest (app-deployment.yaml)#
apiVersion: apps/v1
kind: Deployment
metadata:
  name: order-service
  namespace: production
  labels:
    app.kubernetes.io/name: order-service
    app.kubernetes.io/part-of: knetwork-commerce
spec:
  replicas: 4
  strategy:
    400 font-semibold">type: RollingUpdate
    rollingUpdate:
      maxSurge: 25%
      maxUnavailable: 0
  selector:
    matchLabels:
      app: order-service
  template:
    metadata:
      labels:
        app: order-service
      annotations:
        prometheus.io/scrape: 400 font-semibold">class="text-emerald-300">"400">true"
        prometheus.io/port: 400 font-semibold">class="text-emerald-300">"8080"
        prometheus.io/path: 400 font-semibold">class="text-emerald-300">"/metrics"
    spec:
      terminationGracePeriodSeconds: 60
      containers:
        - name: order-service
          image: ghcr.io/knetwork-live/order-service:v2.4.0
          imagePullPolicy: IfNotPresent
          ports:
            - name: http
              containerPort: 8080
          resources:
            requests:
              cpu: 400 font-semibold">class="text-emerald-300">"250m"
              memory: 400 font-semibold">class="text-emerald-300">"512Mi"
            limits:
              cpu: 400 font-semibold">class="text-emerald-300">"1000m"
              memory: 400 font-semibold">class="text-emerald-300">"1024Mi"
          lifecycle:
            preStop:
              exec:
                command: [400 font-semibold">class="text-emerald-300">"/bin/sh", 400 font-semibold">class="text-emerald-300">"-c", 400 font-semibold">class="text-emerald-300">"sleep 15"]
          readinessProbe:
            httpGet:
              path: /health/ready
              port: http
            initialDelaySeconds: 10
            periodSeconds: 5
            timeoutSeconds: 2
            successThreshold: 1
            failureThreshold: 3
          livenessProbe:
            httpGet:
              path: /health/live
              port: http
            initialDelaySeconds: 15
            periodSeconds: 10
            timeoutSeconds: 2
            failureThreshold: 3
4.2 Why the preStop: sleep 15 Hook is Mandatory#
The preStop hook executes synchronously before the container is sent SIGTERM. By forcing the Pod to sleep for 15 seconds:- The Pod continues serving active traffic normally.
- The Kubernetes control plane updates
EndpointSlices. - NGINX Ingress and
kube-proxyremove the Pod IP from their load balancing tables. - Only after the 15-second grace window expires—when zero new requests are being routed to the Pod—does
SIGTERMexecute. - In-flight requests have an additional 45 seconds (
60s total grace - 15s sleep) to finish clean transaction processing beforeSIGKILL.
5. Declarative Flagger Canary Custom Resource Definition (CRD)#
Flagger abstracts the entire Blue/Green and Canary lifecycle behind a single declarative resource: Canary.
When applied, Flagger intercepts the order-service Deployment and creates two managed deployments:
order-service-primary: The stable production stack (Blue).order-service: The target deployment used for new releases (Green/Canary).
5.1 The Canary Specification (canary-order-service.yaml)#
apiVersion: flagger.app/v1beta1
kind: Canary
metadata:
  name: order-service
  namespace: production
spec:
  400 font-semibold">class=400 font-semibold">class="text-emerald-300">"text-slate-500 italic"># Target deployment to control
  targetRef:
    apiVersion: apps/v1
    kind: Deployment
    name: order-service

  400 font-semibold">class=400 font-semibold">class="text-emerald-300">"text-slate-500 italic"># Ingress reference to manipulate
  ingressRef:
    apiVersion: networking.k8s.io/v1
    kind: Ingress
    name: order-service

  400 font-semibold">class=400 font-semibold">class="text-emerald-300">"text-slate-500 italic"># Autoscaling configuration
  autoscalerRef:
    apiVersion: autoscaling/v2
    kind: HorizontalPodAutoscaler
    name: order-service

  400 font-semibold">class=400 font-semibold">class="text-emerald-300">"text-slate-500 italic"># Progression schedule and analysis
  service:
    port: 8080
    targetPort: 8080
    name: order-service
    trafficPolicy:
      tls:
        mode: DISABLE

  analysis:
    400 font-semibold">class=400 font-semibold">class="text-emerald-300">"text-slate-500 italic"># Analysis interval between canary step increments
    interval: 1m
    400 font-semibold">class=400 font-semibold">class="text-emerald-300">"text-slate-500 italic"># Max retries / failed metric checks before aborting
    threshold: 5
    400 font-semibold">class=400 font-semibold">class="text-emerald-300">"text-slate-500 italic"># Max traffic routed to canary (100% 400 font-semibold">for full cutover)
    maxWeight: 50
    400 font-semibold">class=400 font-semibold">class="text-emerald-300">"text-slate-500 italic"># Step increment per interval
    stepWeight: 10

    400 font-semibold">class=400 font-semibold">class="text-emerald-300">"text-slate-500 italic"># Statistical validation gates
    metrics:
      - name: request-success-rate
        thresholdRange:
          min: 99.5
        interval: 1m
      - name: request-duration
        thresholdRange:
          max: 250
        interval: 1m

    400 font-semibold">class=400 font-semibold">class="text-emerald-300">"text-slate-500 italic"># Pre-rollout and during-rollout automated webhook verifications
    webhooks:
      - name: pre-rollout-smoke-test
        400 font-semibold">type: pre-rollout
        url: http:400 font-semibold">class=400 font-semibold">class="text-emerald-300">"text-slate-500 italic">//flagger-loadtester.production/
        timeout: 15s
        metadata:
          400 font-semibold">type: bash
          cmd: 400 font-semibold">class="text-emerald-300">"curl -sf http:400 font-semibold">class="text-slate-500 italic400 font-semibold">class="text-emerald-300">">//order-service-canary.production:8080/health/deep | grep 'STATUS_OK'"

      - name: continuous-load-test
        400 font-semibold">type: rollout
        url: http:400 font-semibold">class=400 font-semibold">class="text-emerald-300">"text-slate-500 italic">//flagger-loadtester.production/
        timeout: 5s
        metadata:
          400 font-semibold">type: cmd
          cmd: 400 font-semibold">class="text-emerald-300">"hey -z 1m -q 10 -c 2 http:400 font-semibold">class="text-slate-500 italic400 font-semibold">class="text-emerald-300">">//order-service-canary.production:8080/api/v1/orders/benchmark"
5.2 How NGINX Ingress Implements Traffic Splitting#
During canary execution, Flagger creates a companion Ingress object:order-service-canary. It injects dynamic annotations to partition traffic at the edge:
apiVersion: networking.k8s.io/v1
kind: Ingress
metadata:
  name: order-service-canary
  namespace: production
  annotations:
    nginx.ingress.kubernetes.io/canary: 400 font-semibold">class="text-emerald-300">"400">true"
    nginx.ingress.kubernetes.io/canary-weight: 400 font-semibold">class="text-emerald-300">"20"
NGINX evaluates client traffic probabilistically. With canary-weight: "20", exactly 20% of random incoming requests hitting https://api.knetwork.live/orders are dispatched to the order-service-canary pods, while 80% continue hitting order-service-primary.
6. Prometheus Metric Analysis: Defining P99 Latency & 5xx Threshold Gates#
Automated safety requires mathematical rigor. Relying on simple HTTP health checks is insufficient; a new build might return HTTP 200 OK on health endpoints while leaking memory, deadlocking database locks, or spiking P99 latency to 3,000ms.
Flagger connects to Prometheus to run continuous PromQL vector evaluations during every analysis step.
6.1 Custom Prometheus Metric Template (metric-template-p99.yaml)#
apiVersion: flagger.app/v1beta1
kind: MetricTemplate
metadata:
  name: p99-latency-check
  namespace: production
spec:
  provider:
    400 font-semibold">type: prometheus
    address: http:400 font-semibold">class=400 font-semibold">class="text-emerald-300">"text-slate-500 italic">//prometheus-k8s.monitoring.svc.cluster.local:9090
  query: |
    histogram_quantile(
      0.99,
      sum(
        rate(
          http_request_duration_seconds_bucket{
            namespace=400 font-semibold">class="text-emerald-300">"production",
            app=400 font-semibold">class="text-emerald-300">"order-service-canary"
          }[1m]
        )
      ) by (le)
    ) * 1000
6.2 Error Rate Gate#
To calculate request success rate over 60-second sliding windows:
sum(
  rate(
    http_requests_total{
      namespace=400 font-semibold">class="text-emerald-300">"production",
      app=400 font-semibold">class="text-emerald-300">"order-service-canary",
      status!~400 font-semibold">class="text-emerald-300">"5.*"
    }[1m]
  )
)
/
sum(
  rate(
    http_requests_total{
      namespace=400 font-semibold">class="text-emerald-300">"production",
      app=400 font-semibold">class="text-emerald-300">"order-service-canary"
    }[1m]
  )
) * 100
If the success rate drops below 99.5% or P99 latency exceeds 250ms, Flagger increments its failure counter. If failures reach threshold: 5, Flagger cuts the canary weight back to 0% immediately.
7. Automated Webhooks: Smoke Testing & Gatekeepers#
Before any real user touches a canary build, Flagger can execute automated validation suites. We deploy a flagger-loadtester pod in the cluster that acts as an orchestration gateway.
CANARY ROLLOUT LIFECYCLE HOOKS:

┌─────────────────┐
│ 1. Git Push / CI│ ──► kubectl set image deployment/order-service ...
└────────┬────────┘
         │
         ▼
┌─────────────────┐
│ 2. Pre-Rollout  │ ──► Webhook: Integration test against canary 400 font-semibold">private service
│    Validation   │     curl http:400 font-semibold">class=400 font-semibold">class="text-emerald-300">"text-slate-500 italic">//order-service-canary:8080/health/deep
└────────┬────────┘
         │ (Passed)
         ▼
┌─────────────────┐
│ 3. Traffic Ramp │ ──► Step 1: 10% Canary Weight
│    & Analysis   │     Continuous Prometheus metric polling (1m interval)
└────────┬────────┘
         │ (Passed)
         ▼
┌─────────────────┐
│ 4. Promotion    │ ──► Primary stack updated with 400 font-semibold">new image
│                 │     Traffic flipped to 100% Primary
└────────┬────────┘
         │
         ▼
┌─────────────────┐
│ 5. Post-Rollout │ ──► Slack / Datadog deployment confirmation webhook
│    Finalization │     Canary scaled down to 0 replicas
└─────────────────┘
8. Failure Simulation: Forcing Synthetic Errors & Triggering Rollback#
To verify that the safety mechanisms function under duress, we execute a controlled failure injection test.
Step 1: Trigger Rollout of Faulty Container#
We deploy a build containing an intentional synthetic fault (v2.5.0-faulty) that triggers a 5% rate of HTTP 500 errors under load:
kubectl set image deployment/order-service \
  order-service=ghcr.io/knetwork-live/order-service:v2.5.0-faulty \
  -n production
Step 2: Observe Flagger Controller Logs#
$ kubectl -n production logs deploy/flagger -f

New revision detected! Scaling up order-service.production
Waiting 400 font-semibold">for order-service.production to achieve readiness
Pre-rollout check passed 400 font-semibold">for order-service.production
Starting canary analysis 400 font-semibold">for order-service.production
Advance order-service.production canary weight 10
Advance order-service.production canary weight 20
Halt order-service.production advancement: request-success-rate 97.2% < 99.5% (failure 1/5)
Halt order-service.production advancement: request-success-rate 96.8% < 99.5% (failure 2/5)
Halt order-service.production advancement: request-success-rate 96.4% < 99.5% (failure 3/5)
Halt order-service.production advancement: request-success-rate 96.9% < 99.5% (failure 4/5)
Halt order-service.production advancement: request-success-rate 96.1% < 99.5% (failure 5/5)
Canary failed! Scaling down order-service.production
Rolling back order-service.production traffic to primary stack (100% Blue)
Canary order-service.production failed, rollback complete
Step 3: Verify Zero User Impact#
Throughout the entire 5-minute failure cycle:- 98% of users routed to
order-service-primaryexperienced zero errors. - The 20% canary cohort experienced transient retries managed by NGINX Ingress upstream retries (
proxy_next_upstream error timeout http_502 http_503). - The primary deployment was never overwritten.
- Rollback Latency:
0.8 seconds(instant annotation removal on NGINX Ingress).
9. Architectural Comparison: Deployment Topology Trade-Offs#
PRODUCTION ATTRIBUTE COMPARISON:

┌────────────────────────────┬─────────────────────┬───────────────────────┐
│ Architectural Dimension    │ Native K8s Rolling  │ Flagger + Ingress     │
├────────────────────────────┼─────────────────────┼───────────────────────┤
│ Failure Detection          │ CrashLoopBackOff    │ Prometheus PromQL     │
│ Rollback Mechanism         │ Manual 400 font-semibold">class="text-emerald-300">`undo`       │ Automated within 60s  │
│ Traffic Granularity        │ Replica Count Steps │ Percentage (1% - 100%)│
│ In-Flight Protection       │ Needs manual hook   │ Built-in lifecycle    │
│ Infrastructure Overhead    │ 0%                  │ Single Flagger Pod    │
│ Blast Radius of Poison Pill│ 100% of Fleet       │ Capped at stepWeight  │
│ Compliance Audit Trail     │ Ephemeral K8s Event │ Persistent CRD Events │
└────────────────────────────┴─────────────────────┴───────────────────────┘
10. Production Verification & Day-2 Operations Runbook#
To ensure ongoing reliability across enterprise clusters, adhere to these operational principles:
- Database Schema Backward Compatibility: Progressive delivery mandates that the database schema must simultaneously support container version
Nand versionN+1. Always apply the Expand/Contract (Parallel Run) database pattern: add new nullable columns in Phase 1, deploy code that writes to both in Phase 2, backfill data in Phase 3, and remove old columns in Phase 4. - Prometheus High Availability: Flagger relies directly on Prometheus availability. If Prometheus becomes unreachable, Flagger pauses progression by default rather than blindly promoting canaries.
- Session Affinity (Sticky Canaries): For stateful B2B portals requiring session persistence, configure cookie-based canary tracking via:
nginx.ingress.kubernetes.io/canary-by-cookie: "user_session". This ensures that a single user consistently stays on either Blue or Green throughout their entire session.
Frequently Asked Questions#
1. What is the fundamental difference between Canary and Blue/Green deployment?#
Blue/Green deployment runs two complete environments (Blue and Green) and executes an instant cutover of 100% of user traffic from Blue to Green once verified. Canary deployment incrementally routes small percentages of real user traffic (e.g., 5%, 10%, 25%, 50%) to the new version while continuously monitoring telemetry metrics (latency, error rates) before committing to a full 100% promotion.2. Why does Kubernetes RollingUpdate cause 502 errors during high load?#
When a Pod terminates, the Kubernetes control plane informs bothkubelet and kube-proxy concurrently. kubelet sends SIGTERM to the container, which often stops listening immediately. However, updating iptables or IPVS routing tables across all cluster nodes takes 1 to 5 seconds. During this window, the Ingress controller continues routing new connections to the dead or dying Pod, producing 502 Bad Gateway errors.3. How does the preStop hook eliminate dropped connections?#
A preStop: exec: command: ["sleep", "15"] directive forces the container to pause before receiving SIGTERM. During this 15-second delay, the Pod continues processing requests while the Ingress controller and kube-proxy remove its IP address from active load balancer pools. Once all routing tables have updated, SIGTERM is delivered, ensuring zero dropped requests.4. Do I need a service mesh like Istio to use Flagger?#
No. While Flagger integrates with Istio and Linkerd, it also provides native support for Ingress controllers such as NGINX Ingress, Traefik, and Contour. By using NGINX Ingress canary annotations (nginx.ingress.kubernetes.io/canary-weight), teams achieve progressive delivery without the CPU, memory, and operational complexity of a full service mesh.5. What metrics should trigger an automated canary rollback?#
Production-grade gates should evaluate at least two distinct dimensions: Error Rate (HTTP 5xx responses exceeding 0.1% to 0.5% of total requests) and P99 Latency (99th percentile request duration exceeding baseline by more than 25% or surpassing an absolute SLA such as 250ms). Monitoring both catches crashes as well as silent resource starvation and deadlocks.Frequently Asked Questions
Key questions answered regarding this architectural implementation.
Danisur Rahman
Lead AuthorPrincipal Cloud & DevOps Architect • KNetwork Systems
Principal architect specializing in enterprise distributed systems, edge caching, and hardware integration pipelines. Leads engineering audits, high-concurrency database optimizations, and zero-trust VPC deployments across high-growth ventures.
More From The Engineering Blog
Deep systems breakdowns and production deployment guides.
First-Party Attribution Engines: Reconciling Offline CRM Sales with Web CAPI
Bypass pixel loss and iOS privacy barriers: Architect server-side first-party attribution, stitch deterministic identity graphs, and sync offline CRM deals to Meta CAPI.
Zero-Copy Parquet Lakehouses: Ingesting IoT Telemetry with Apache Iceberg
Eliminate Hive directory bottlenecks and small-file chaos: ACID snapshot trees, automated asynchronous compaction, hidden partitioning, and zero-copy multi-engine analytics.
Enjoyed this technical breakdown?
Subscribe to receive new architectural guides, system teardowns, and engineering benchmarks directly in your inbox.