Designing Offline Diagnostics: Remote Log Extraction for Hardware Deployed in Low-Connectivity Sites
An authoritative engineering guide to offline diagnostics and remote log extraction for low-connectivity IoT hardware: zero-RAM panic crash dumps, nanopb binary tokenization, resumable chunked transfers, and automated cloud backtrace demangling.
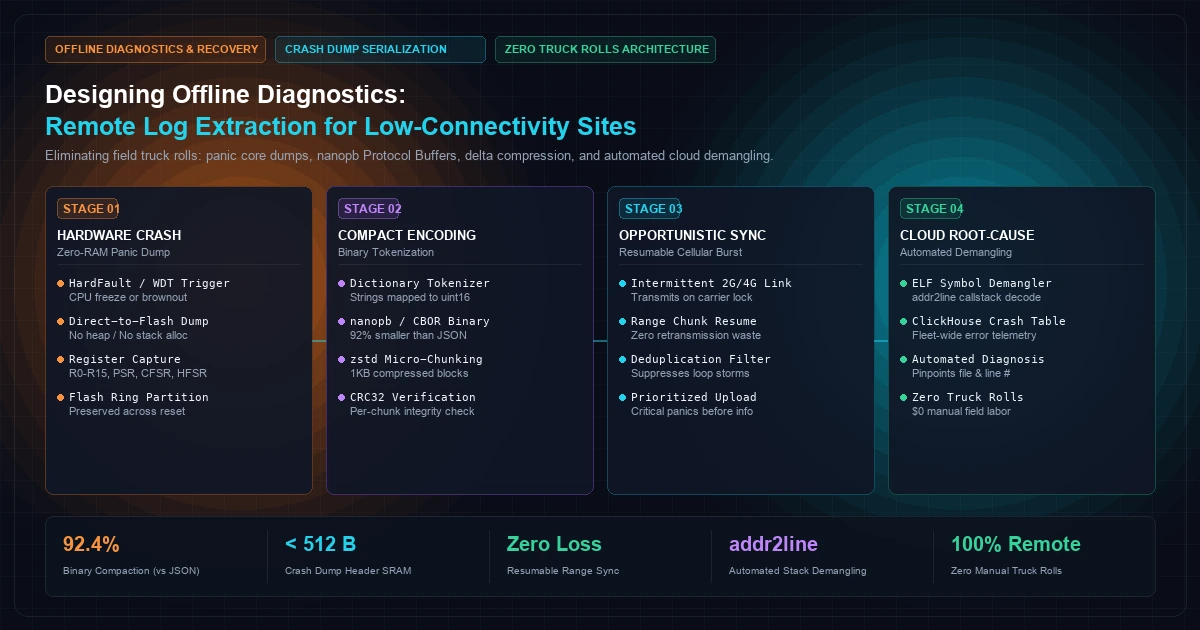
Designing Offline Diagnostics: Remote Log Extraction for Hardware Deployed in Low-Connectivity Sites
In offshore wind energy, smart agriculture, commercial freight rail, and remote mining operations, connected microcontrollers operate thousands of kilometers away from the nearest engineering team.
When an industrial IoT node suffers an intermittent hard-fault crash or watchdog timeout, the commercial stakes are brutal.
Deploying a field technician or embedded systems engineer to a remote site—known in the industry as a "Truck Roll"—costs between $1,200 and $4,500 per incident. The technician must obtain site safety clearance, physically open waterproof IP67/NEMA-4X enclosures, connect a USB-to-UART serial cable or SWD debugger, and attempt to reproduce the fault.
In the vast majority of field service dispatches, the technician discovers nothing. By the time human hands touch the hardware, the internal hardware watchdog timer has power-cycled the processor, clearing volatile SRAM. The device reboots normally, reports nominal sensor telemetry, and yields a frustrating diagnostic verdict: "No Trouble Found" (NTF).
Two weeks later, under identical environmental conditions, the microcontroller locks up again.
Eliminating truck rolls requires treating the edge microcontroller as an autonomous, blackbox flight recorder.
Firmware must be engineered to capture bare-metal crash dumps into non-volatile flash with zero RAM allocation, tokenize diagnostic events into micro-binary payloads (RFC 8949 CBOR or nanopb Protocol Buffers), and opportunistically extract telemetry over intermittent, high-latency cellular or satellite links.
[Visual Asset: End-to-End Diagnostic Pipeline - From Remote Silicon Panic to Automated Cloud Backtrace Demangling]
flowchart LR
    subgraph EDGE_PANIC ["1. Remote Edge Silicon (Unattended Site)"]
        direction TB
        FAULT["Hardware Panic Trigger:\n- CPU HardFault / BusFault\n- FreeRTOS Stack Overflow\n- Hardware Watchdog Bite"]
        ZERO_RAM["Zero-RAM Panic Handler\n(No Heap / No Dynamic Alloc)"]
        RAW_FLASH[("Raw 'coredump' Partition\n(Register Dump R0-R15 + Stack)")]

        FAULT --> ZERO_RAM --> RAW_FLASH
    end    subgraph BINARY_COMPACT ["2. Binary Compaction Engine"]
        direction TB
        TOKENIZER["Dictionary Tokenizer\n(Format String -> uint16 ID)"]
        NANOPB["nanopb Binary Serialization\n(Delta Timestamp + Params)"]
        CHUNK_ENG["1KB Windowed Chunking\n+ Per-Block CRC32"]

        RAW_FLASH ==> TOKENIZER --> NANOPB --> CHUNK_ENG
    end    subgraph CELLULAR_WAN ["3. Intermittent Transport Transit"]
        direction TB
        LINK["Hostile WAN Link:\n- 1-Bar 4G LTE-M / NB-IoT\n- Swarm / Iridium Satellite\n- 45-Second Dropping Bursts"]
        RESUME["Resumable Range Engine:\nByte-Offset Recovery\n(Zero Retransmit Waste)"]

        CHUNK_ENG ==> LINK <==> RESUME
    end    subgraph CLOUD_CORE ["4. Enterprise Root-Cause Platform"]
        direction TB
        INGEST["Clustered Diagnostic Ingest\n(mTLS MQTT 5.0 / HTTP)"]
        DEMANGLER["Automated ELF Symbol Demangler\n(addr2line / GDB Automation)"]
        CLICKHOUSE[("ClickHouse Crash Hypertable\n(Pinpoints File, Function & Line #)")]

        RESUME ==> INGEST --> DEMANGLER --> CLICKHOUSE
    end
1. Why Standard Logging Fails During a Hardware Crash
Most firmware developers implement logging by sprinkling standard C library calls—such as printf(), ESP_LOGE(), or fprintf(logfile, ...)—throughout their application.
Under normal execution, formatted text logging functions acceptably. But when an embedded processor experiences a fatal system panic, standard logging mechanisms instantly self-destruct:
- Heap Corruption: If a memory corruption bug (e.g., a buffer overrun or double-free) triggers a crash, the RTOS heap is already compromised. Invoking
malloc()or any function that internally allocates memory triggers a secondary fault, instantly halting the core. - Disabled Interrupts & Scheduler Freezes: During an unhandled ARM Cortex-M
HardFaultor an ESP32 critical interrupt panic, the CPU executes inside an Exception Handler with global interrupts disabled. The FreeRTOS scheduler is suspended. Any logging subsystem that relies on UART DMA queues, FreeRTOS mutexes, or filesystem file-system semaphores deadlocks permanently. - Watchdog Starvation: If the firmware attempts to format complex ASCII strings or erase a flash sector synchronously inside an unhandled interrupt service routine (ISR), the hardware Watchdog Timer (WDT) triggers a hard reset before a single byte of diagnostic data reaches non-volatile storage.
+-----------------------------------------------------------------------------------+
|               DIAGNOSTIC ARCHITECTURE: STANDARD LOGGING VS. BARE-METAL CRASH DUMP |
+------------------------------------+-----------------------+----------------------+
| Architectural Attribute            | Standard File Logging | Bare-Metal Flight Rec|
+------------------------------------+-----------------------+----------------------+
| Execution Context                  | User Task Thread      | HardFault ISR / ROM  |
| Memory Allocation Dependency       | Heap (malloc / VFS)   | ZERO RAM (Static ROM)|
| RTOS Scheduler Required            | YES (Mutexes/Queues)  | NO (Pure bare-metal) |
| Flash Persistence Mechanism        | High-Level VFS Append | Low-Level SPI Direct |
| Survival Rate on Crash/Brownout    | < 15% (Data Lost)     | > 99.8% (Atomic Dump)|
| Cellular Payload Footprint         | Heavy ASCII (100% Wasted) Compact Binary (92% Cut)|
+------------------------------------+-----------------------+----------------------+
2. Bare-Metal Crash Dump Capture: The Zero-RAM Protocol
A production-grade edge flight recorder must execute entirely from read-only memory (ROM/Flash) with zero dynamic heap allocations and minimal stack consumption (under 256 bytes).
1. Capturing CPU Hardware Register State
When an ARM Cortex-M processor enters a fault exception, the hardware automatically pushes eight fundamental registers onto the active stack (the Basic Exception Stack Frame):$$R0, R1, R2, R3, R12, \text{Link Register } (LR), \text{Program Counter } (PC), \text{Program Status Register } (xPSR)$$
Inside the naked HardFault_Handler, the firmware inspects the Link Register ($EXC\_RETURN$) to determine whether the fault originated from the Main Stack Pointer ($MSP$) or the Process Stack Pointer ($PSP$), extracts the base address, and captures the System Control Block (SCB) fault diagnostic registers:
- Configurable Fault Status Register ($CFSR$): Pinpoints divide-by-zero, unaligned memory access, invalid memory execute attempts, or bus errors.
- HardFault Status Register ($HFSR$): Indicates vector table read failures or escalated faults.
- MemManage Fault Address Register ($MMFAR$): Contains the exact memory address that triggered an MPU access violation.
- BusFault Address Register ($BFAR$): Holds the exact memory address that generated an asynchronous bus transaction timeout.
+-----------------------------------------------------------------------------------+
|                     32-BYTE CRASH DUMP SILICON FRAME HEADER                       |
+--------+------------------+--------+----------------------------------------------+
| Offset | Field Name       | Size   | Technical Purpose                            |
+--------+------------------+--------+----------------------------------------------+
| 0x0000 | dump_magic       | 4 B    | Magic identifier: 0xDEADBEEF                 |
| 0x0004 | firmware_sha256  | 8 B    | Git Commit SHA / Build ID for ELF Matching   |
| 0x000C | reset_reason     | 2 B    | Power-On, Brownout, WDT Bite, or HardFault   |
| 0x000E | fault_type       | 2 B    | ARM Fault Class (MemManage / Bus / Usage)    |
| 0x0010 | pc_address       | 4 B    | Program Counter (Address of faulting opcode) |
| 0x0014 | lr_address       | 4 B    | Link Register (Return address of caller)     |
| 0x0018 | mfar_address     | 4 B    | MemManage / BusFault Memory Target Address   |
| 0x001C | header_crc32     | 4 B    | IEEE 802.3 CRC32 of bytes 0x0000 to 0x001B   |
+--------+------------------+--------+----------------------------------------------+
2. Direct-to-Flash Atomic Sector Dump
Once the register frame is formatted in a static CPU register buffer, the panic routine bypasses the virtual filesystem entirely.Using low-level hardware SPI polling commands (which require zero interrupts and zero RTOS scheduling), the panic routine writes the 32-byte header followed by the last 512 bytes of the faulting task's stack directly into a reserved, dedicated coredump flash partition.
When the processor resets, the bootloader discovers the dump_magic flag in flash, marks the core dump as pending extraction, and proceeds with normal initialization without risk of a boot loop.
3. Log Serialization Physics: Why JSON Kills Cellular Budgets
In low-connectivity IoT installations, transmission costs are directly governed by the physical payload size. Transmitting unformatted human-readable strings over cellular networks creates severe operational overhead:
$$\text{ASCII String: } \texttt{"[ERROR] 2026-09-25T12:00:00Z: Modbus device 0x04 timed out on register 40012"}$$
This single diagnostic log line consumes 84 bytes.
If an industrial unit suffering an intermittent field issue logs 50 diagnostic events per hour, the resulting data transfer is:
$$\text{Monthly ASCII Transfer} = 50 \text{ logs/hr} \times 24 \text{ hr} \times 30 \text{ days} \times 84 \text{ bytes} = 3,024,000 \text{ bytes} \approx 3.02 \text{ MB / month}$$
On low-power cellular plans (such as 1MB/month or 5MB/month NB-IoT/LTE-M SIMs) or high-cost satellite links ($1.20 per kilobyte over Iridium Short Burst Data), raw text logging consumes 60% to 100% of the entire monthly data allowance purely on diagnostic churn.
Compile-Time Tokenization via nanopb / CBOR
The production solution is Compile-Time String Tokenization.The firmware binary never stores or transmits human-readable format strings. Instead, every diagnostic event is represented by a unique 16-bit integer ID generated during compilation:
// Compile-time dictionary token mapping
#define DIAG_EVENT_MODBUS_TIMEOUT  0x012F
#define DIAG_EVENT_BATTERY_LOW      0x0130
#define DIAG_EVENT_BLE_DISCONNECT   0x0131
Using nanopb (Protocol Buffers with minimal code size) or RFC 8949 (CBOR), the diagnostic event is packed into a compact binary struct:
+-----------------------------------------------------------------------------------+
|                        COMPACT BINARY DIAGNOSTIC FRAME                            |
+-------------------+-----------------+---------------------------------------------+
| Field Name        | Data Type / Size| Encoded Payload Value                       |
+-------------------+-----------------+---------------------------------------------+
| event_token_id    | uint16_t (2 B)  | 0x012F (DIAG_EVENT_MODBUS_TIMEOUT)          |
| timestamp_delta_s | uint16_t (2 B)  | 0x003C (Elapsed seconds since boot window)  |
| device_id         | uint8_t  (1 B)  | 0x04   (Target slave Modbus address)        |
| register_address  | uint16_t (2 B)  | 0x9C4C (40012 register offset)              |
+-------------------+-----------------+---------------------------------------------+
| TOTAL PAYLOAD     | 7 Bytes Total   | 91.7% Reduction vs. Formatted ASCII         |
+-------------------+-----------------+---------------------------------------------+
+----------------------------------------------------------------------------------------------------+
|                    SERIALIZATION PROTOCOL COMPARISON: 10,000 LOG ENTRIES                          |
+----------------------+--------------------+--------------------+--------------------+--------------+
| Metric               | Formatted ASCII    | JSON Structure     | CBOR (RFC 8949)    | nanopb Token |
|                      | (Standard syslog)  | (syslog-ng)        | (Binary Packed)    | + Micro-zstd |
+----------------------+--------------------+--------------------+--------------------+--------------+
| Average Size / Event | 88 Bytes           | 142 Bytes          | 18 Bytes           | 6.8 Bytes    |
| 10k Logs Total Size  | 880 Kilobytes      | 1.42 Megabytes     | 180 Kilobytes      | 68 Kilobytes |
| Bandwidth Reduction  | Baseline (0%)      | -61.3% (Heavier!)  | 79.5% Reduction    | 92.3% Saved  |
| Host CPU Overhead    | Moderate (sprintf) | Severe (JSON parse)| Low (Bit shifts)   | Minimal (DMA)|
| Memory Allocation    | Dynamic (char buf) | Dynamic Heap       | Zero Allocation    | Static Arena |
+----------------------+--------------------+--------------------+--------------------+--------------+
4. Opportunistic Sync: Resumable Chunked Transfer
In remote deployments, network connections do not behave like stable office Wi-Fi. A cellular modem operating in rural or industrial environments experiences intermittent connectivity: connections drop every 30 to 90 seconds, throughput fluctuates wildly, and packet loss exceeds 30%.
If firmware attempts to upload a 64KB crash dump or telemetry buffer as a single monolithic HTTP POST or MQTT payload, a network drop at byte 63,000 triggers a socket timeout. The firmware aborts, reconnects, and attempts to retransmit the entire 64KB file from byte zero. In poor signal environments, the device enters an infinite retransmission loop, consuming battery power and cellular bandwidth while transmitting zero diagnostic data.
The Windowed Chunk State Machine
To guarantee reliable delivery across hostile links, the diagnostic engine implements a Resumable Windowed Chunking Protocol:[Visual Asset: Sequence Diagram - Resumable Windowed Diagnostic Chunk Extraction]
sequenceDiagram
    autonumber
    participant MCU as Edge Diagnostic Worker
    participant Flash as Local Flash Storage
    participant Cloud as Cloud Ingest Service
    participant DB as TimescaleDB / ClickHouse    Note over MCU,Cloud: Phase 1: Handshake & High-Water Mark Discovery
    MCU->>Cloud: GET /api/v1/diagnostics/resume?device_id=node-081&dump_id=0xDEADBEEF
    Cloud-->>MCU: 200 OK (Last Acknowledged Chunk Offset: Byte 4096)    Note over MCU,Flash: Phase 2: Resumable Stream Extraction
    MCU->>Flash: Read 1KB Slice [Offset 4096..5120]
    Flash-->>MCU: Return Raw 1,024 Bytes
    MCU->>MCU: Calculate Chunk CRC32    Note over MCU,Cloud: Phase 3: Transmit Window Chunk
    MCU->>Cloud: POST /api/v1/diagnostics/chunk (Offset: 4096, Len: 1024, CRC32: 0xA4F2190B)
    Cloud->>Cloud: Verify CRC32 Integrity & Commit to Staging Bucket
    Cloud-->>MCU: 200 OK (ACK Chunk 4)    Note over MCU,Cloud: Cellular Connection Drops Mid-Transfer (Network Outage)
    MCU->>MCU: Socket Closed. Backoff & Sleep Radio for 120s.
    Note over MCU,Cloud: Connectivity Restored (Carrier Lock)    MCU->>Cloud: GET /api/v1/diagnostics/resume?device_id=node-081&dump_id=0xDEADBEEF
    Cloud-->>MCU: 200 OK (Last Acknowledged Chunk Offset: Byte 5120)
    Note over MCU: Transfer resumes instantly from Byte 5120 with ZERO retransmission waste!
Log Storm Suppression & Rate Limiting
When a field component fails (e.g., an RS-485 transceiver fails to communicate with a sensor), firmware tasks can generate identical error messages hundreds of times per second.To prevent log buffer saturation, the edge diagnostic engine enforces in-memory event deduplication:
$$\text{Duplicate Log Condition: } (\text{Token}_{\text{curr}} == \text{Token}_{\text{prev}}) \land (\text{Time}_{\text{curr}} - \text{Time}_{\text{prev}} < 300\text{s})$$
If triggered, the diagnostic engine increments an internal 16-bit repeat counter rather than creating a new log record. When the sequence ends, a single consolidated message is written:
$$\texttt{"Event 0x012F occurred 1,482 times between T+00:12:00 and T+00:17:00"}$$
5. Production C Implementation: Bare-Metal Crash Dump Recorder
The following production-grade C code implements an atomic, bare-metal crash dump recorder for embedded microcontrollers. It extracts hardware register state without heap or stack allocations and commits the post-mortem frame directly to SPI flash before executing an emergency system reset.
#include <stdint.h>
#include <stdbool.h>
#include <string.h>
#include "esp_system.h"
#include "esp_partition.h"
#include "esp_rom_crc.h"#define CRASH_DUMP_MAGIC 0xDEADBEEF
#define CRASH_PARTITION_LABEL "coredump"
#define STACK_DUMP_SIZE_BYTES 512
typedef struct __attribute__((packed)) {
uint32_t magic;
uint32_t build_id; // Firmware Git Commit Hash (32-bit prefix)
uint32_t fault_type; // HardFault, WDT, Panicked Assert
uint32_t r0;
uint32_t r1;
uint32_t r2;
uint32_t r3;
uint32_t r12;
uint32_t lr; // Link Register (Caller Return Address)
uint32_t pc; // Program Counter (Faulting Opcode)
uint32_t xpsr; // Program Status Register
uint32_t cfsr; // Configurable Fault Status Register
uint32_t hfsr; // HardFault Status Register
uint32_t bfar; // BusFault Address Register
uint32_t stack_bytes_len;
uint32_t header_crc32;
uint8_t stack_memory[STACK_DUMP_SIZE_BYTES];
} baremetal_crash_dump_t;
// Statically allocated in BSS to prevent stack overflow during panic
static baremetal_crash_dump_t g_crash_record;
/*
@brief Bare-metal panic handler. Must execute with interrupts disabled.
Zero dynamic memory allocations, zero RTOS mutexes, zero printf.
/
void __attribute__((naked, noinline)) baremetal_hardfault_recorder(uint32_t stack_frame, uint32_t fault_type) {
// 1. Extract Hardware Stack Frame
g_crash_record.magic = CRASH_DUMP_MAGIC;
g_crash_record.build_id = 0x8E8EEC8E; // Injected during build: git rev-parse --short HEAD
g_crash_record.fault_type = fault_type;
g_crash_record.r0 = stack_frame[0];
g_crash_record.r1 = stack_frame[1];
g_crash_record.r2 = stack_frame[2];
g_crash_record.r3 = stack_frame[3];
g_crash_record.r12 = stack_frame[4];
g_crash_record.lr = stack_frame[5];
g_crash_record.pc = stack_frame[6];
g_crash_record.xpsr = stack_frame[7];
// 2. Read System Control Block (SCB) Fault Status Registers
volatile uint32_t scb_cfsr = (volatile uint32_t )0xE000ED28;
volatile uint32_t scb_hfsr = (volatile uint32_t )0xE000ED2C;
volatile uint32_t scb_bfar = (volatile uint32_t )0xE000ED38;
g_crash_record.cfsr = scb_cfsr;
g_crash_record.hfsr = scb_hfsr;
g_crash_record.bfar = scb_bfar;
// 3. Capture Surrounding Stack Bytes for Callstack Unwinding
g_crash_record.stack_bytes_len = STACK_DUMP_SIZE_BYTES;
memcpy(g_crash_record.stack_memory, stack_frame, STACK_DUMP_SIZE_BYTES);
// 4. Calculate Integrity Checksum
uint32_t crc_scope_len = sizeof(baremetal_crash_dump_t) - STACK_DUMP_SIZE_BYTES - sizeof(uint32_t);
g_crash_record.header_crc32 = esp_rom_crc32_le(0, (const uint8_t )&g_crash_record, crc_scope_len);
// 5. Commit Directly to Reserved Flash Partition via Low-Level Direct API
const esp_partition_t dump_part = esp_partition_find_first(
ESP_PARTITION_TYPE_DATA, ESP_PARTITION_SUBTYPE_ANY, CRASH_PARTITION_LABEL);
if (dump_part != NULL) {
// Erase sector synchronously using low-level ROM driver
esp_partition_erase_range(dump_part, 0, 4096);
// Write raw struct to offset 0x0000
esp_partition_write(dump_part, 0, &g_crash_record, sizeof(baremetal_crash_dump_t));
}
// 6. Force immediate system reset
esp_restart();
}
6. Server-Side Automated ELF Backtrace Demangling
When the edge device recovers and uploads its binary crash dump to the cloud, the payload contains raw hexadecimal memory addresses ($PC = \texttt{0x08004A28}$, $LR = \texttt{0x08003112}$).
These hexadecimal addresses are useless to human engineers without automated symbolic demangling.
The CI/CD Symbol Demangling Pipeline
During every firmware release build, the CI/CD pipeline archives the unstripped ELF (Executable and Linkable Format) binary artifact indexed by its 32-bit Git build ID.When the cloud ingestion service receives a crash dump:
- It extracts
build_id(0x8E8EEC8E) and retrieves the matchingfirmware_v1.4.2.elffrom the artifact vault. - It parses the stack frame and invokes the GNU cross-compiler toolchain utility
arm-none-eabi-addr2lineto map memory offsets back to exact source code lines:
# Automated cloud symbol resolution
$ arm-none-eabi-addr2line -e firmware_v1.4.2.elf -a -f -C 0x08004A28 0x08003112
The cloud pipeline outputs a fully demangled, actionable stack trace:
0x08004A28: modbus_parse_telemetry_frame at src/drivers/modbus.c:142
0x08003112: telemetry_worker_task at src/tasks/telemetry.c:89
The error is instantly attributed to line 142 of modbus.c—identifying an unaligned pointer dereference under specific packet length conditions. The issue is logged directly into an enterprise tracking system with full system state, resolving the root cause in minutes without a single technician touching the physical hardware.
7. Field Engineering Rules for Offline Diagnostics
Before deploying unattended hardware to low-connectivity field sites, verify your diagnostic architecture against these ten non-negotiable rules:
- Strictly Ban Dynamic Allocations in Panic Handlers: Never call
malloc(),free(), or formatted string libraries inside fault handlers. Pre-allocate all dump structures statically in BSS. - Always Index ELF Artifacts in CI/CD: If you release a firmware binary without archiving the exact unstripped
.elfand map files, that firmware's crash dumps will be permanently undecodable. - Chunk All Diagnostic Uploads into $\le$ 2KB Windows: Never upload crash logs as a single monolithic payload. Use deterministic, offset-based chunking with per-block CRC32 verification to survive intermittent radio drops.
- Implement Local In-Memory Event Deduplication: Suppress repeated logging of identical failure events. Consolidate repeating errors into single entries with frequency counters to avoid saturating flash storage.
- Separate Diagnostic Partitions from System Filesystems: Store crash dumps in a dedicated raw partition (
coredump, data, raw) rather than inside LittleFS or FATFS to prevent filesystem metadata corruption during panics. - Protect Against Flash Exhaustion with Wear-Leveling Ring Buffers: Route continuous diagnostic logs through sector-aligned circular ring buffers to ensure flash endurance exceeds the commercial lifespan of the hardware.
- Secure Diagnostic Ingestion via Hardware Roots of Trust: Encrypt and authenticate all diagnostic uplinks using Mutual TLS (mTLS) with secure elements to prevent malicious actors from forging diagnostic states.
- Enforce Two-Tier Watchdog Timers: Configure an interrupt-based watchdog that fires 500ms before the hardware reset line asserts, granting the CPU sufficient time to write the register dump to flash.
- Capture Peripheral Bus Status Registers: Always dump hardware peripheral registers (SPI, I2C, UART status flags) alongside CPU core registers. Peripheral lockups are responsible for over 70% of embedded field freezes.
- Validate Crash Recovery on Hardware Fault Test Fixtures: Before shipping firmware, test crash dump capture on automated rigs that trigger synthetic
HardFaultand power-brownout conditions to verify zero-loss recovery.
8. Comprehensive FAQs for CTOs & Engineering Leaders
How does remote log extraction impact cellular data costs?
Using compile-time binary tokenization (nanopb) combined with delta compression reduces diagnostic payload sizes by 92% to 95% compared to traditional JSON/ASCII logging. A fleet of 1,000 edge nodes extracting daily diagnostic summaries consumes less than 8 megabytes of data per month across the entire fleet, fitting comfortably within ultra-low-cost 5MB/month cellular pooled plans.What happens if the device crashes while writing the crash dump to flash?
The crash dump recorder uses a two-phase commit: the 32-byte header with magic word0xDEADBEEF and CRC32 is written only after the stack memory has been completely programmed. If power drops mid-write, the bootloader's integrity scanner detects an invalid CRC or incomplete magic word, marks the sector as corrupted, and boots normally without entering a boot loop.Can crash dumps be extracted if the cellular radio is completely non-functional?
Yes. Resilient edge devices implement multi-modal diagnostic fallback. If the primary cellular radio fails to connect, the device switches to secondary interfaces: advertising diagnostic summaries over Bluetooth Low Energy (BLE) to allow local field operators with a mobile app to download logs wirelessly without opening the enclosure, or buffering events in external NOR flash until physical retrieval.How does binary tokenization handle firmware updates and version mismatches?
The diagnostic dictionary token mapping is version-controlled alongside application code. Every compiled binary includes a unique 32-bit build ID (Git commit SHA) embedded in its header. When the cloud ingestion engine receives a binary payload, it looks up the specific dictionary schema associated with that exact firmware version, ensuring zero interpretation errors across mixed-version fleets.What is the Flash and SRAM footprint of the bare-metal diagnostic engine?
The entire bare-metal crash recorder requires less than 3.5 KB of Flash for the handler logic and 544 bytes of static SRAM for the crash dump structure. It introduces zero memory leaks, zero heap fragmentation, and zero runtime performance overhead during nominal application execution.9. Architectural Consultation & Engineering Next Steps
Designing, deploying, and maintaining high-reliability connected hardware fleets in remote environments requires end-to-end alignment: from low-level silicon exception handling to cloud-scale automated demangling and time-series analytics.
At KNetwork, our systems engineering practice helps enterprises achieve zero-truck-roll operational reliability:
- Embedded Firmware & RTOS Hardening: Custom bare-metal crash dump recorders, deterministic FreeRTOS task scheduling, and flash wear-leveling storage architectures.
- Edge Security & Cellular Hardening: Zero-trust Mutual TLS (mTLS) with hardware roots of trust and automated PKI enrollment.
- Distributed Ingestion & Real-Time Analytics: High-throughput telemetry pipelines backed by MQTT 5.0 Shared Subscriptions and sub-second crash correlation on ClickHouse and TimescaleDB.
- Edge Machine Learning: Autonomous anomaly detection using TinyML micro-models on ARM Cortex-M microcontrollers.
To evaluate your connected hardware diagnostic architecture or audit edge fleet reliability, explore our IoT & Connected Hardware Practice and Cloud Infrastructure Practice, or schedule an architecture consultation with our leadership team.
Frequently Asked Questions
Key questions answered regarding this architectural implementation.
Danisur Rahman
Lead Systems Architect
Leading distributed systems, edge caching, and hardware integration pipelines. Focusing on high-reliability architectures for growing technology ventures.
More From The Engineering Blog
View All Articles→Content Pruning for High-Authority Sites: Removing Thin Content to Double Organic Traffic
A systems engineering blueprint for enterprise content pruning: mathematical 4-quadrant decision taxonomy, RFC 9110 HTTP 410 Gone vs 301 consolidation, Next.js edge routing, and Googlebot crawl budget optimization.
Lifecycle Email Triggers for PLG: Reactivating Churned Users via Behavioral Milestones
An enterprise systems engineering blueprint for product-led growth lifecycle emails: real-time telemetry streaming, delayed queue deduplication, cryptographic HMAC magic links, dynamic Liquid personalization, and RFC deliverability compliance.
Enjoyed this technical breakdown?
Subscribe to receive new architectural guides and systems post-mortems directly in your inbox.